Hi Bill, it's good to hear from you.
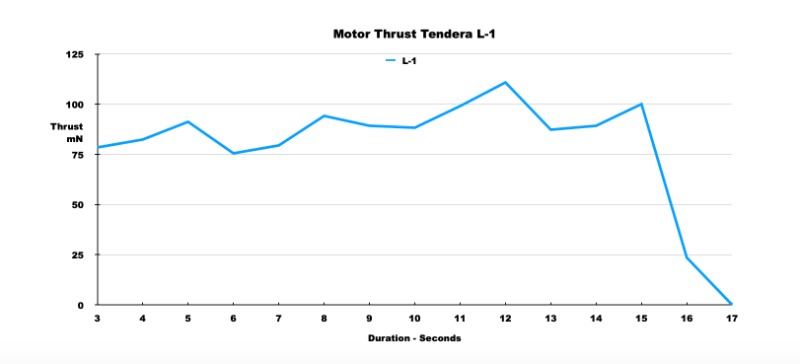
I note your comments regarding the L1. I made a few plots a couple of years ago with a logging system I put together. Those tests seemed to indicate if anything a slight increase in power as the burn proceeded. (possibly as the tube and the mix warmed up.)
I must say I haven't had chance to repeat these tests recently but for what they are worth here is a plot.

Roger adds:
A problem with the thrust/time graphs is that the organisation that produced them are more used to measuring high thrust/short duration motors designed for ballistic-type rocket models. This can make interpretation for our purposes quite difficult. I would trust Terry's graphs more. My 'low-tech' set up too, was more geared to the 70-500 mN thrust motors useful for our very different sorts of models.
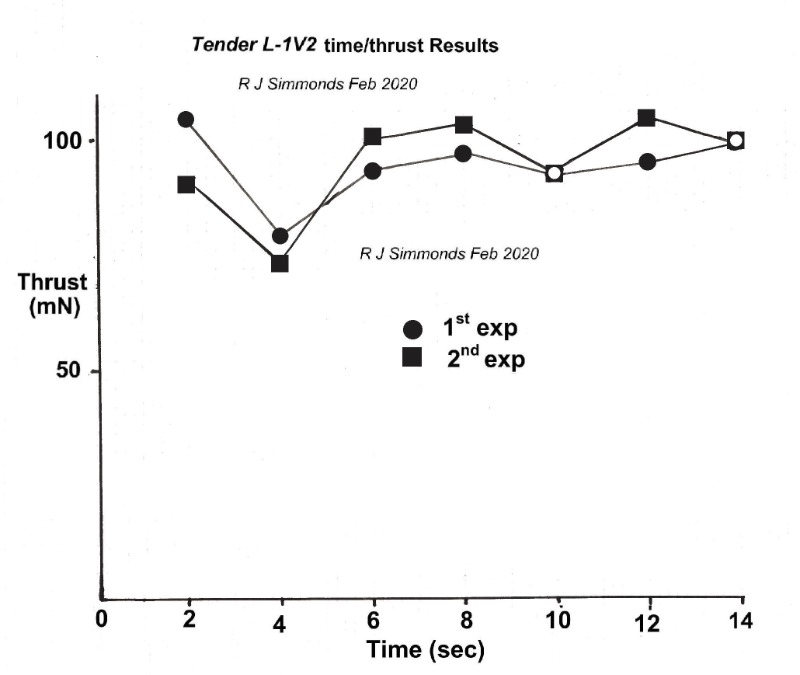
Here is my graph for the L-1 V2 when Piotr, Terry and I were fixing its performance:
Note I have not included the initial 'spike'.
The latest CE TSP motors I've tried match this quite closly.


